背景
最近定位了一个内存泄漏的问题,使用valgrind定位时发现内存泄漏在智能指针处,但看代码以及测试,发现智能指针管理的对象是释放了,一度怀疑是valgrind有问题,花费了很长时间,所幸,总算是定位出来了。
问题分析
将有问题的代码简化后,如下。
 1
 2
 3
 4
 5
 6
 7
 8
 9
10
11
12
13
14
15
16
17
18
19
20
21
22
23
24
25
26
27
28
29
30
31
32
33
34
35
36
37
38
39
40
41
42
43
44
|
#include <stdio.h>
#include <memory>
#include <string.h>
#include <vector>

struct Data
{
    char data[1000];
};

struct Father
{
    Father() {}
    ~Father() {}
};

struct Child : Father
{
    Child() : Father() {}
    ~Child() {}
    void create()
    {
        weak_ptr = std::make_shared<Data>();
    }
    std::weak_ptr<Data> weak_ptr;
};

int main(int, char **)
{
    std::vector<Father *> vec;
    for (int i = 0; i < 10; i++)
    {
        Child *child_ptr = new Child();
        child_ptr->create();
        vec.push_back(child_ptr);
    }

    for (auto &itr : vec)
    {
        delete itr;
    }

    return 0;
}
|
编译代码为可执行文件Demo,之后使用命令valgrind --leak-check=full ./Demo执行,之后会得到以下输出。
 1
 2
 3
 4
 5
 6
 7
 8
 9
10
11
12
13
14
15
16
17
18
19
20
21
22
23
24
25
26
27
28
29
30
31
|
==30176== Memcheck, a memory error detector
==30176== Copyright (C) 2002-2017, and GNU GPL'd, by Julian Seward et al.
==30176== Using Valgrind-3.16.1 and LibVEX; rerun with -h for copyright info
==30176== Command: ./Demo
==30176==
==30176==
==30176== HEAP SUMMARY:
==30176==     in use at exit: 10,240 bytes in 10 blocks
==30176==   total heap usage: 25 allocs, 15 frees, 10,648 bytes allocated
==30176==
==30176== 10,240 bytes in 10 blocks are definitely lost in loss record 1 of 1
==30176==    at 0x4C2A593: operator new(unsigned long) (vg_replace_malloc.c:342)
==30176==    by 0x401290: allocate (new_allocator.h:104)
==30176==    by 0x401290: allocate (alloc_traits.h:351)
==30176==    by 0x401290: __shared_count<Data, std::allocator<Data> > (shared_ptr_base.h:499)
==30176==    by 0x401290: __shared_ptr<std::allocator<Data> > (shared_ptr_base.h:957)
==30176==    by 0x401290: shared_ptr<std::allocator<Data> > (shared_ptr.h:316)
==30176==    by 0x401290: allocate_shared<Data, std::allocator<Data> > (shared_ptr.h:598)
==30176==    by 0x401290: make_shared<Data> (shared_ptr.h:614)
==30176==    by 0x401290: create (main.cpp:24)
==30176==    by 0x401290: main (main.cpp:36)
==30176==
==30176== LEAK SUMMARY:
==30176==    definitely lost: 10,240 bytes in 10 blocks
==30176==    indirectly lost: 0 bytes in 0 blocks
==30176==      possibly lost: 0 bytes in 0 blocks
==30176==    still reachable: 0 bytes in 0 blocks
==30176==         suppressed: 0 bytes in 0 blocks
==30176==
==30176== For lists of detected and suppressed errors, rerun with: -s
==30176== ERROR SUMMARY: 1 errors from 1 contexts (suppressed: 0 from 0)
|
valgrind分析显示shared_ptr分配的内存有泄漏,当时自己没有仔细看函数调用,以为是shared_ptr管理的对象的内存泄漏了。但看代码的话,会发现在第23行,make_shared生成的shared_ptr给到了weak_ptr,而weak_ptr不占用引用计数,因此make_shared生成的Data对象是立即释放了,不应该存在内存泄漏的问题。
给Data结构体增加析构函数后,会看到make_shared执行后,Data的析构函数便立即执行了,所以这里确实不存在内存泄漏的问题。
但valgrind分析又显示存在泄漏,自己一度以为是valgrind的问题,由此也尝试找了其他的内存泄漏分析工具,但试了几个发现有的用起来太麻烦,有的显示的结果有问题。后来自己就各种看代码改代码,浪费了很多时间,也没找出来问题。无奈,又仔细看了下valgrind的分析结果,发现它显示的堆栈中有一个__shared_count,于是查了下该函数是什么函数,查完后,顿时便明白原因在哪了。
shared_ptr由两个指针组成,这里是一个从网上找来的图。一个指针指向实际管理的对象,另一个指针则指向share_count_object对象,该对象用来维护管理shared_ptr的引用计数。
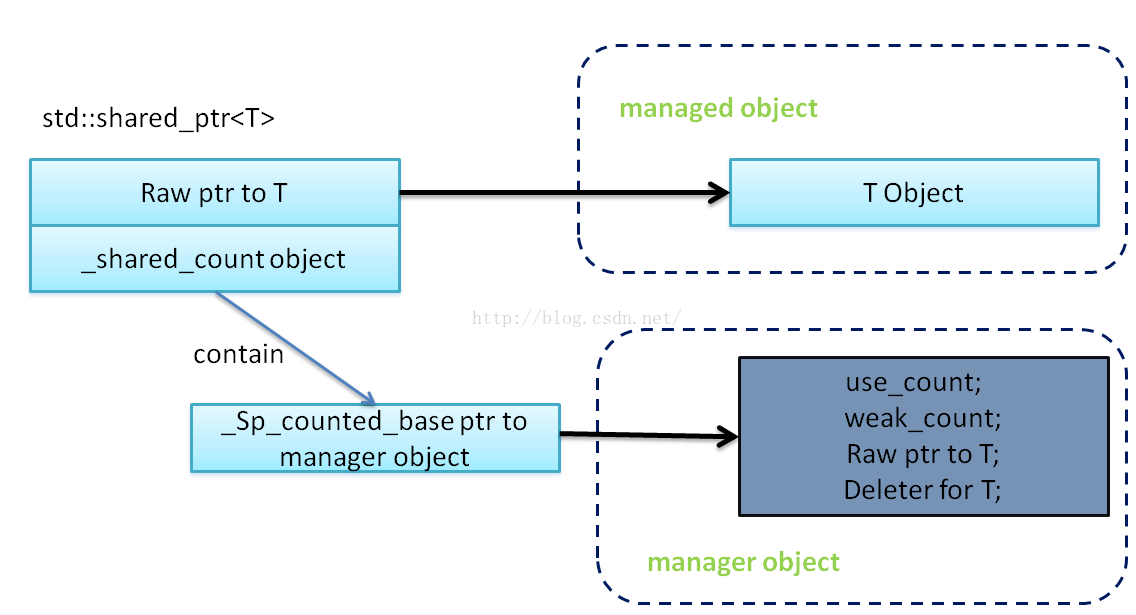
shared_ptr内共有两个引用计数,一个是use_count,一个是weak_count。当use_count为0时,shared_ptr就会把实例管理对象的内存释放掉,而当weak_count为0时,才会把share_count_object对象释放掉。
在上面给的例子中,未释放的内存并不是shared_ptr管理的对象的,而是share_count_object对象的。因为编写程序时的疏忽,Father类的析构函数不是虚析构函数,因此在释放vec变量中存储的Father对象(实际是Child对象)时,并不会调用Child对象的析构函数,这也就导致不会调用Child内部weak_ptr的析构函数,那么weak_count就不会减1为0。也因此,每个Child内的weak_ptr的share_count_object对象内存就都未释放掉。在valgrind显示的堆栈结果中,__shared_count其实已经指明了是share_count_object对象的内存,而不是实际管理对象的内存。
将Father类的析构函数改为虚析构函数,之后再使用valgrind跑一遍,这次便不会出现内存泄漏的信息了。
总结
valgrind是可靠的,碰到反常的结果时,一定要细心,很可能是自己忽略了一些信息导致的。
参考链接
- 从C++ std::shared_ptr 原理来看看栈溢出的危害